Data Explorer: explore detections
Use Data Explorer to choose a period, compare detection patterns, inspect maps, and review receiver diagnostics in the current Dataset.
Quick start: explore detections
- Open a project whose Dataset contains detection records.
- Open Data Explorer and wait for Reading dataset… to clear.
- Drag the highlighted range in Overview, or use the centred range controls, to choose a period.
- In the Detections controls, choose how to Group detections.
- Inspect the detail chart and the ranked transmitter or receiver list for the visible period.
- Hold
Alton Windows orOptionon macOS while hovering when you need exact chart or map values.
The task is complete when the selected period and grouping show the detections you want to inspect.
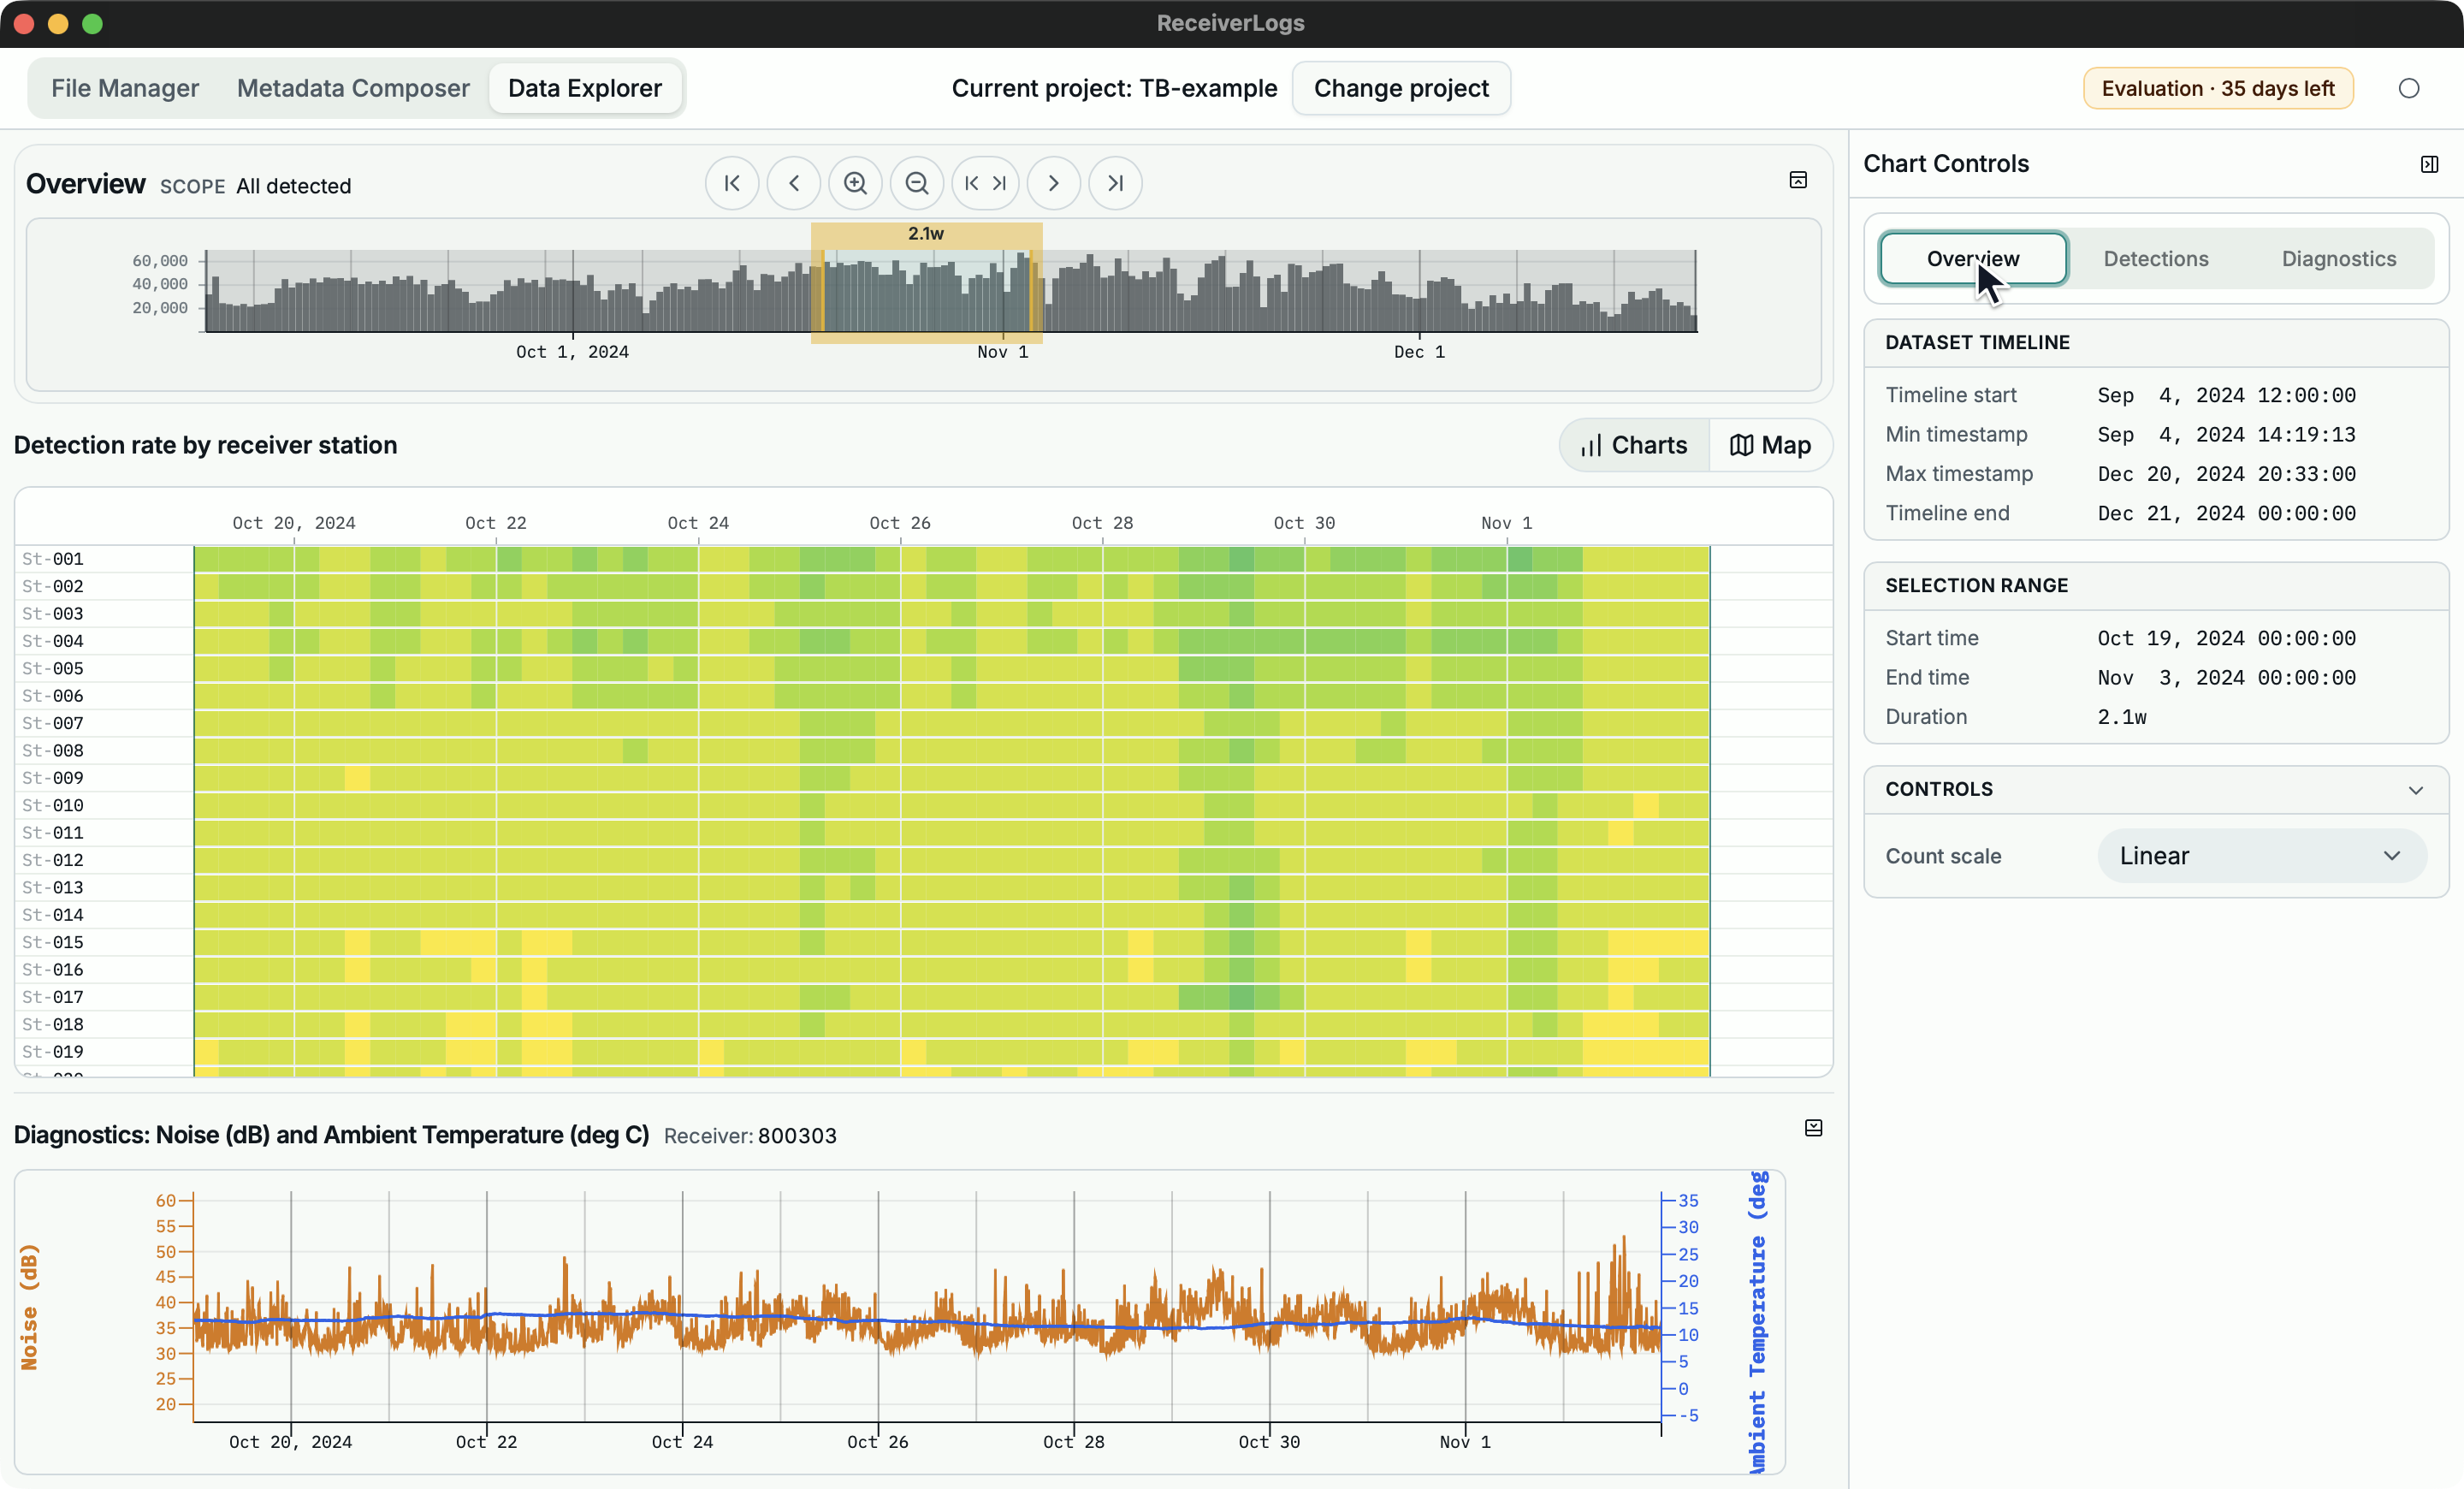
Common Data Explorer tasks
Inspect a shorter period
- Drag across the Overview timeline to create a shorter selection, or drag the edges of the highlighted range.
- Use the toolbar pan and zoom controls for repeatable steps.
- Use Fit Dataset to return to the full Dataset.
The charts, map, diagnostics, and right-hand summaries follow the same selected period.
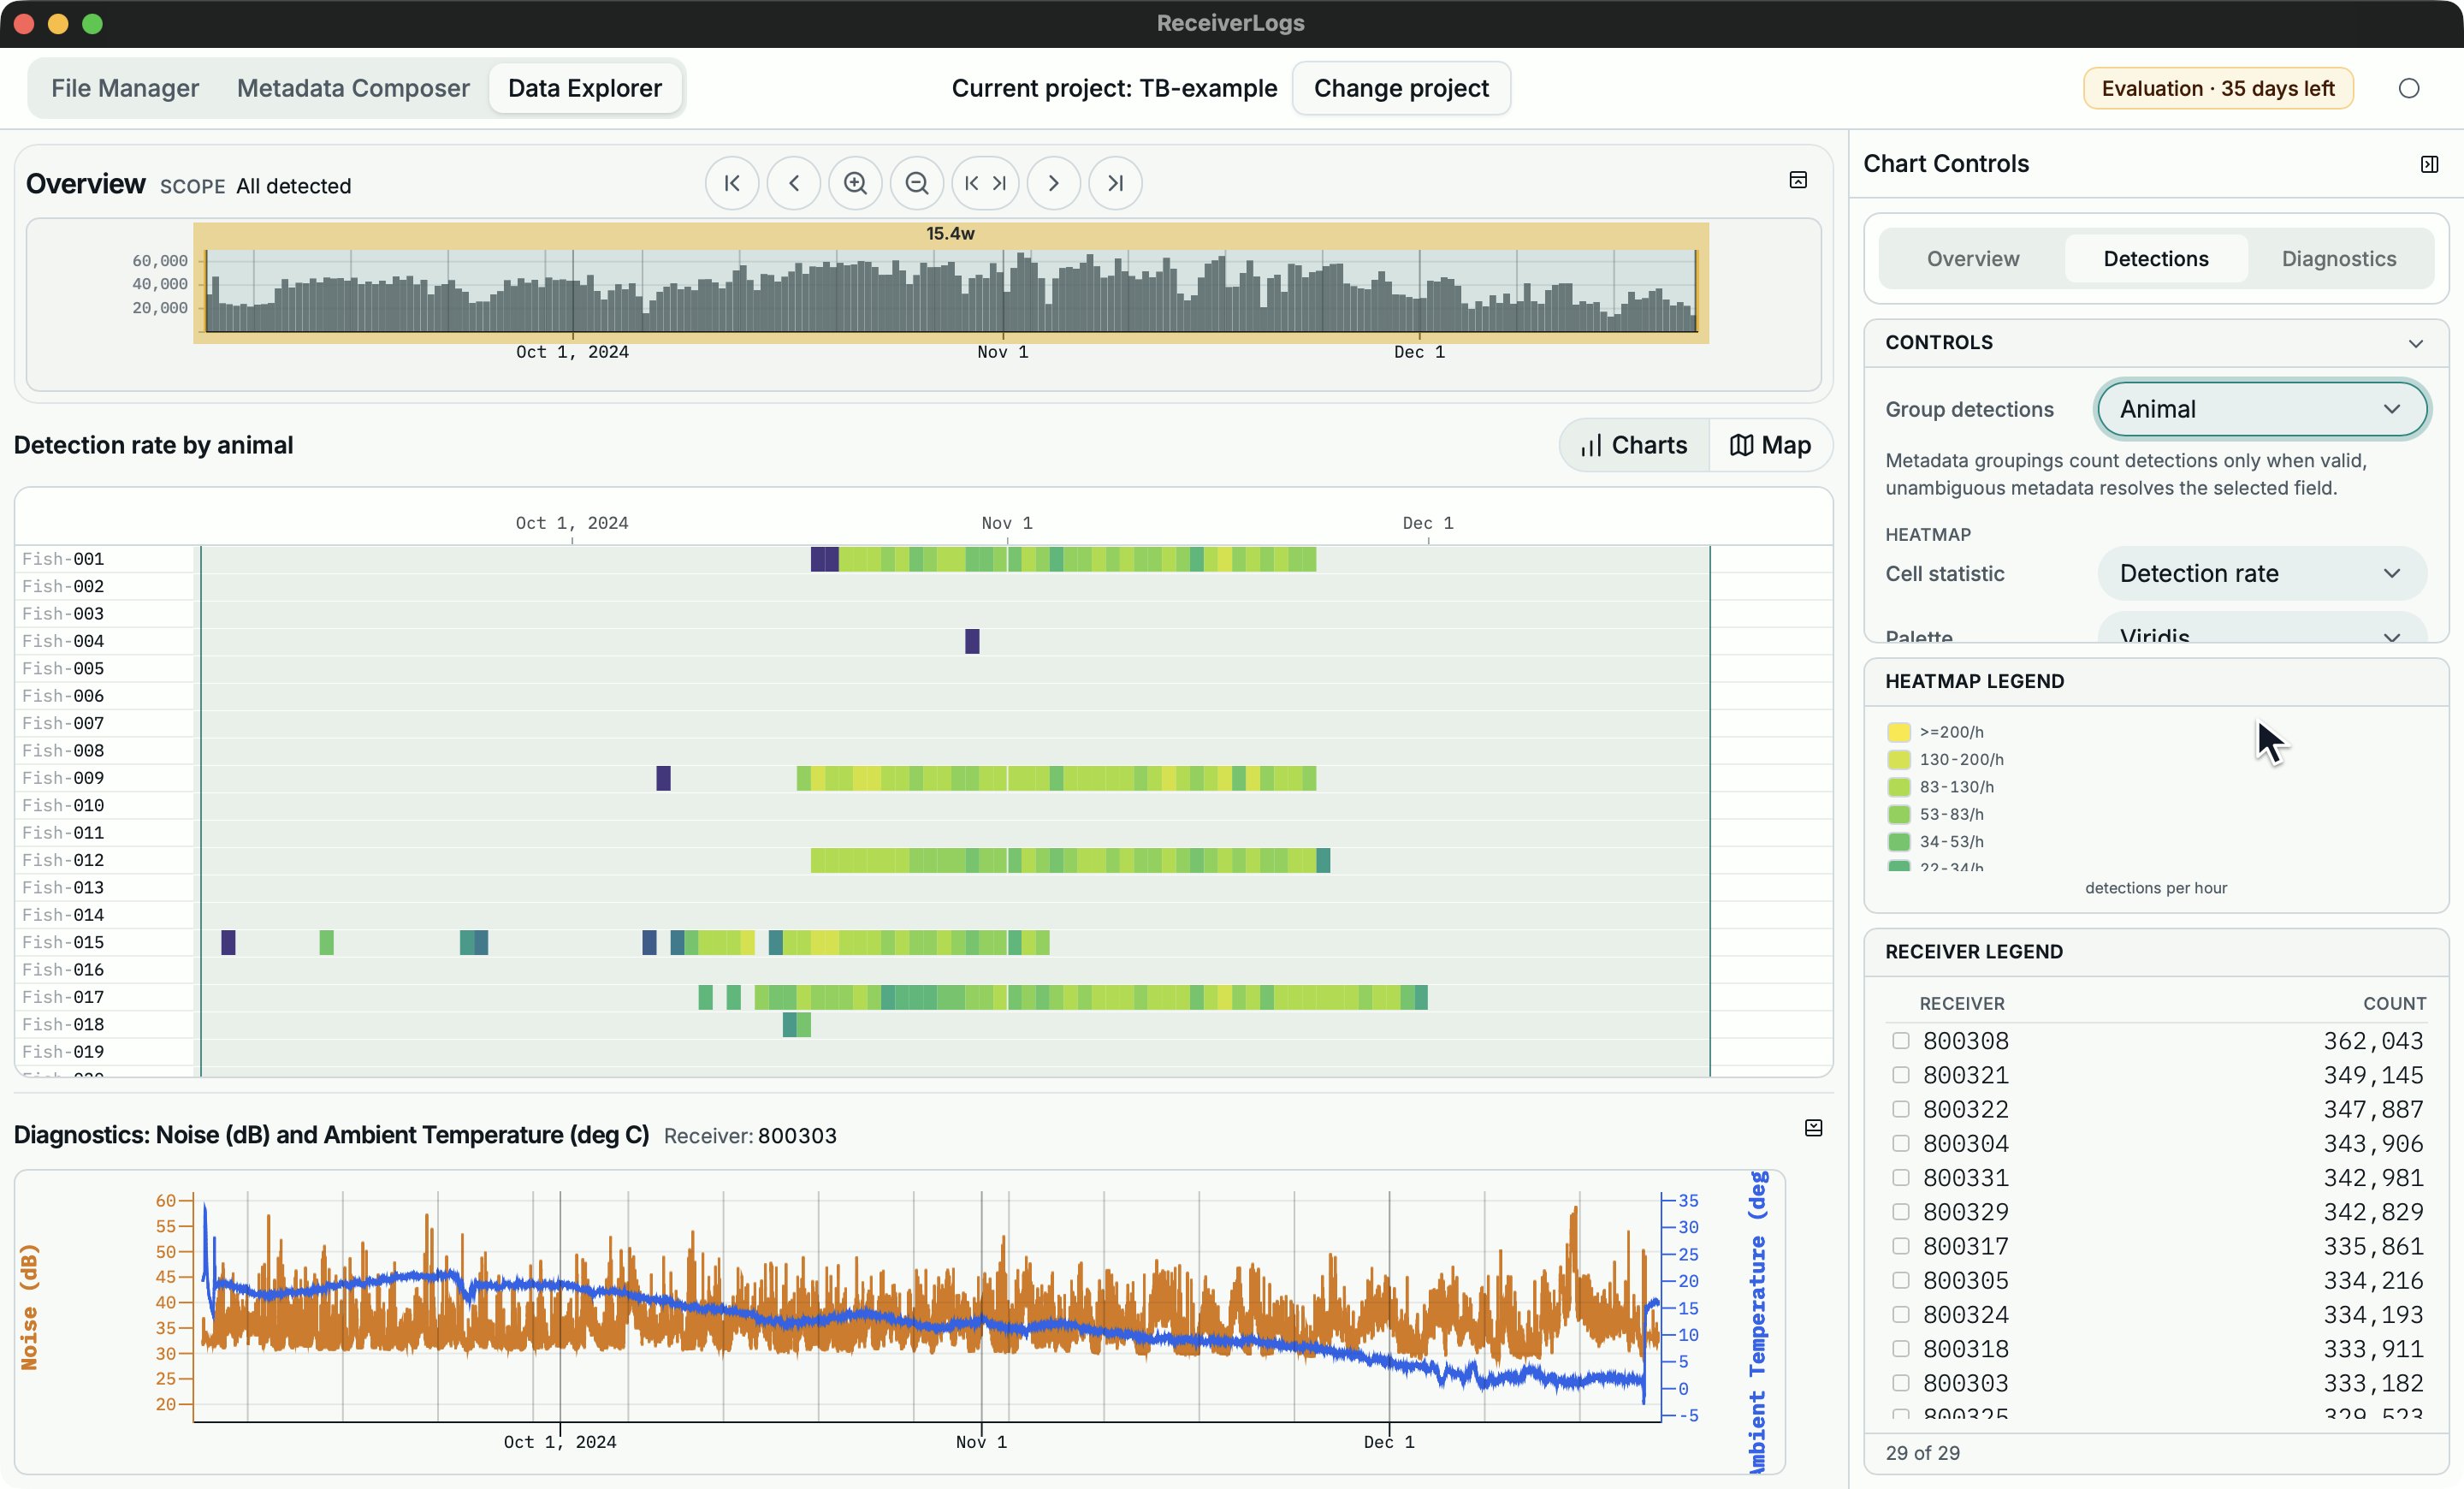
Compare detection patterns by grouping
- Open the Detections controls.
- Choose a value under Group detections.
- Choose Detection rate or an available unique-entity statistic under Cell statistic.
- Review the row labels and ranked list again.
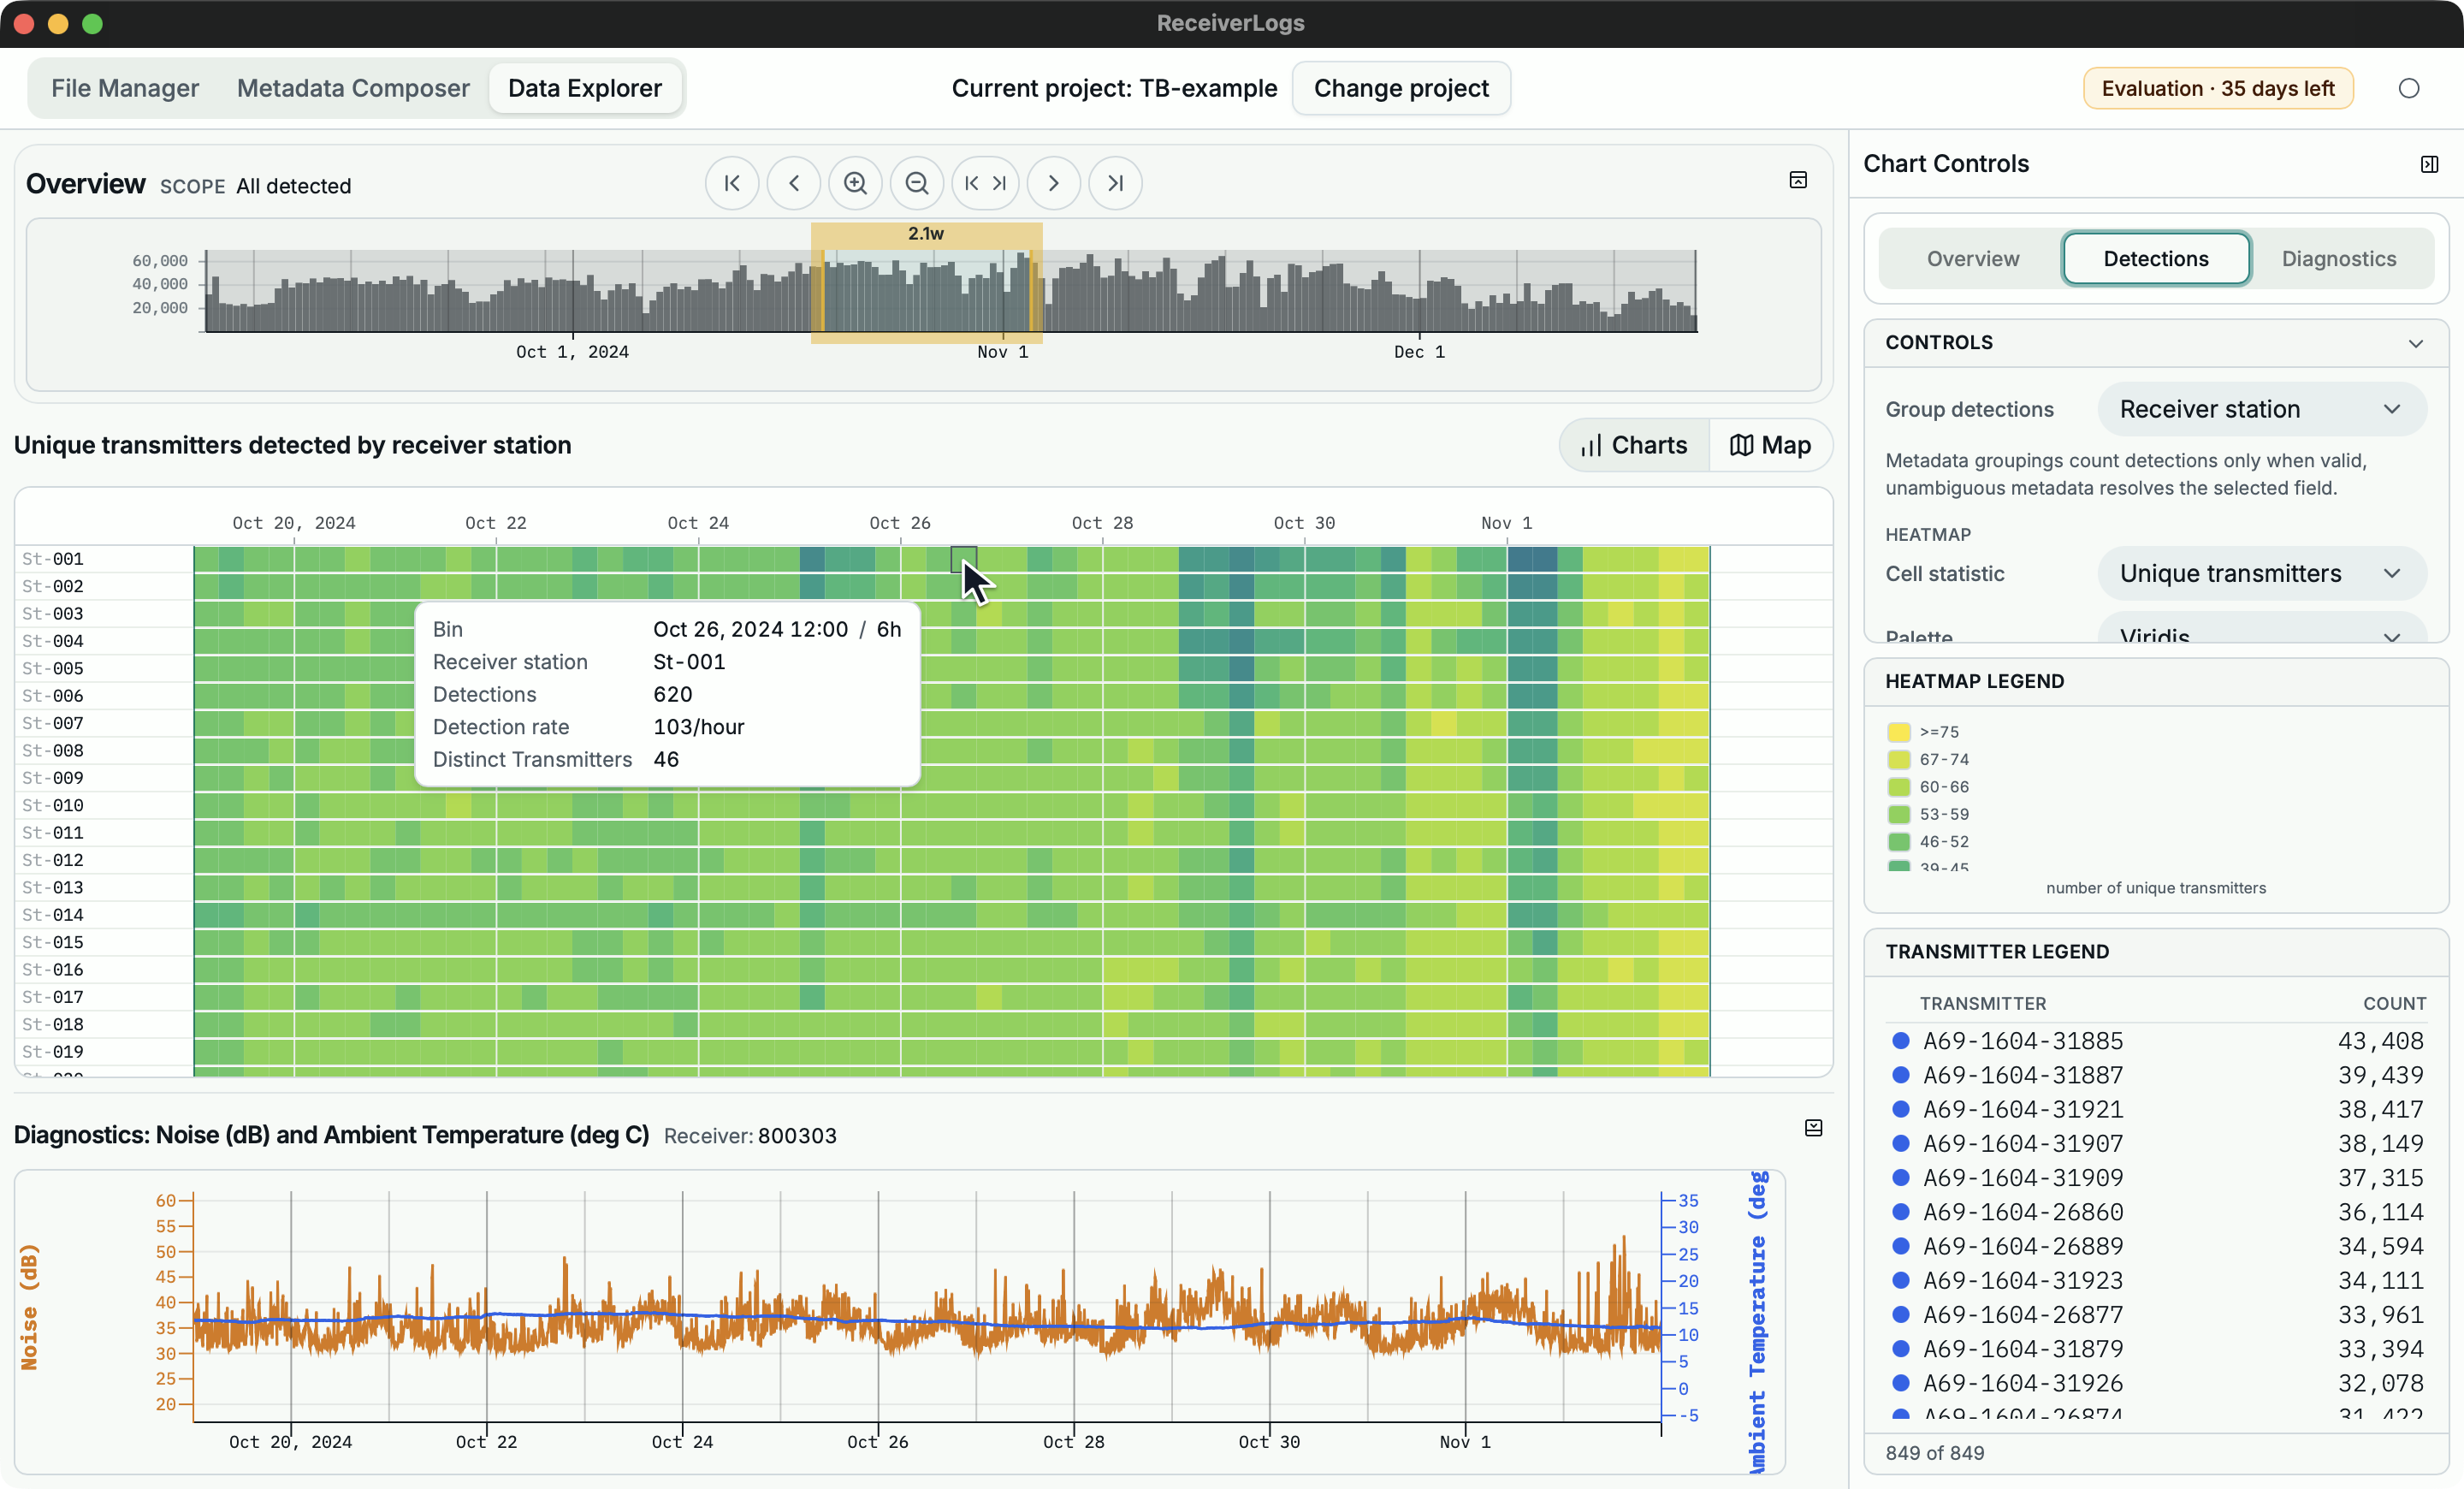
Receiver-oriented rows rank transmitter IDs. Transmitter-oriented rows rank receiver serials. Metadata-backed groupings include only detections whose required station, device, attachment, or animal relationship is valid and unambiguous.
Hold Alt/Option over a heatmap bin to inspect the exact interval and statistic. This is especially useful for checking how many distinct transmitters contributed to one receiver-station interval.
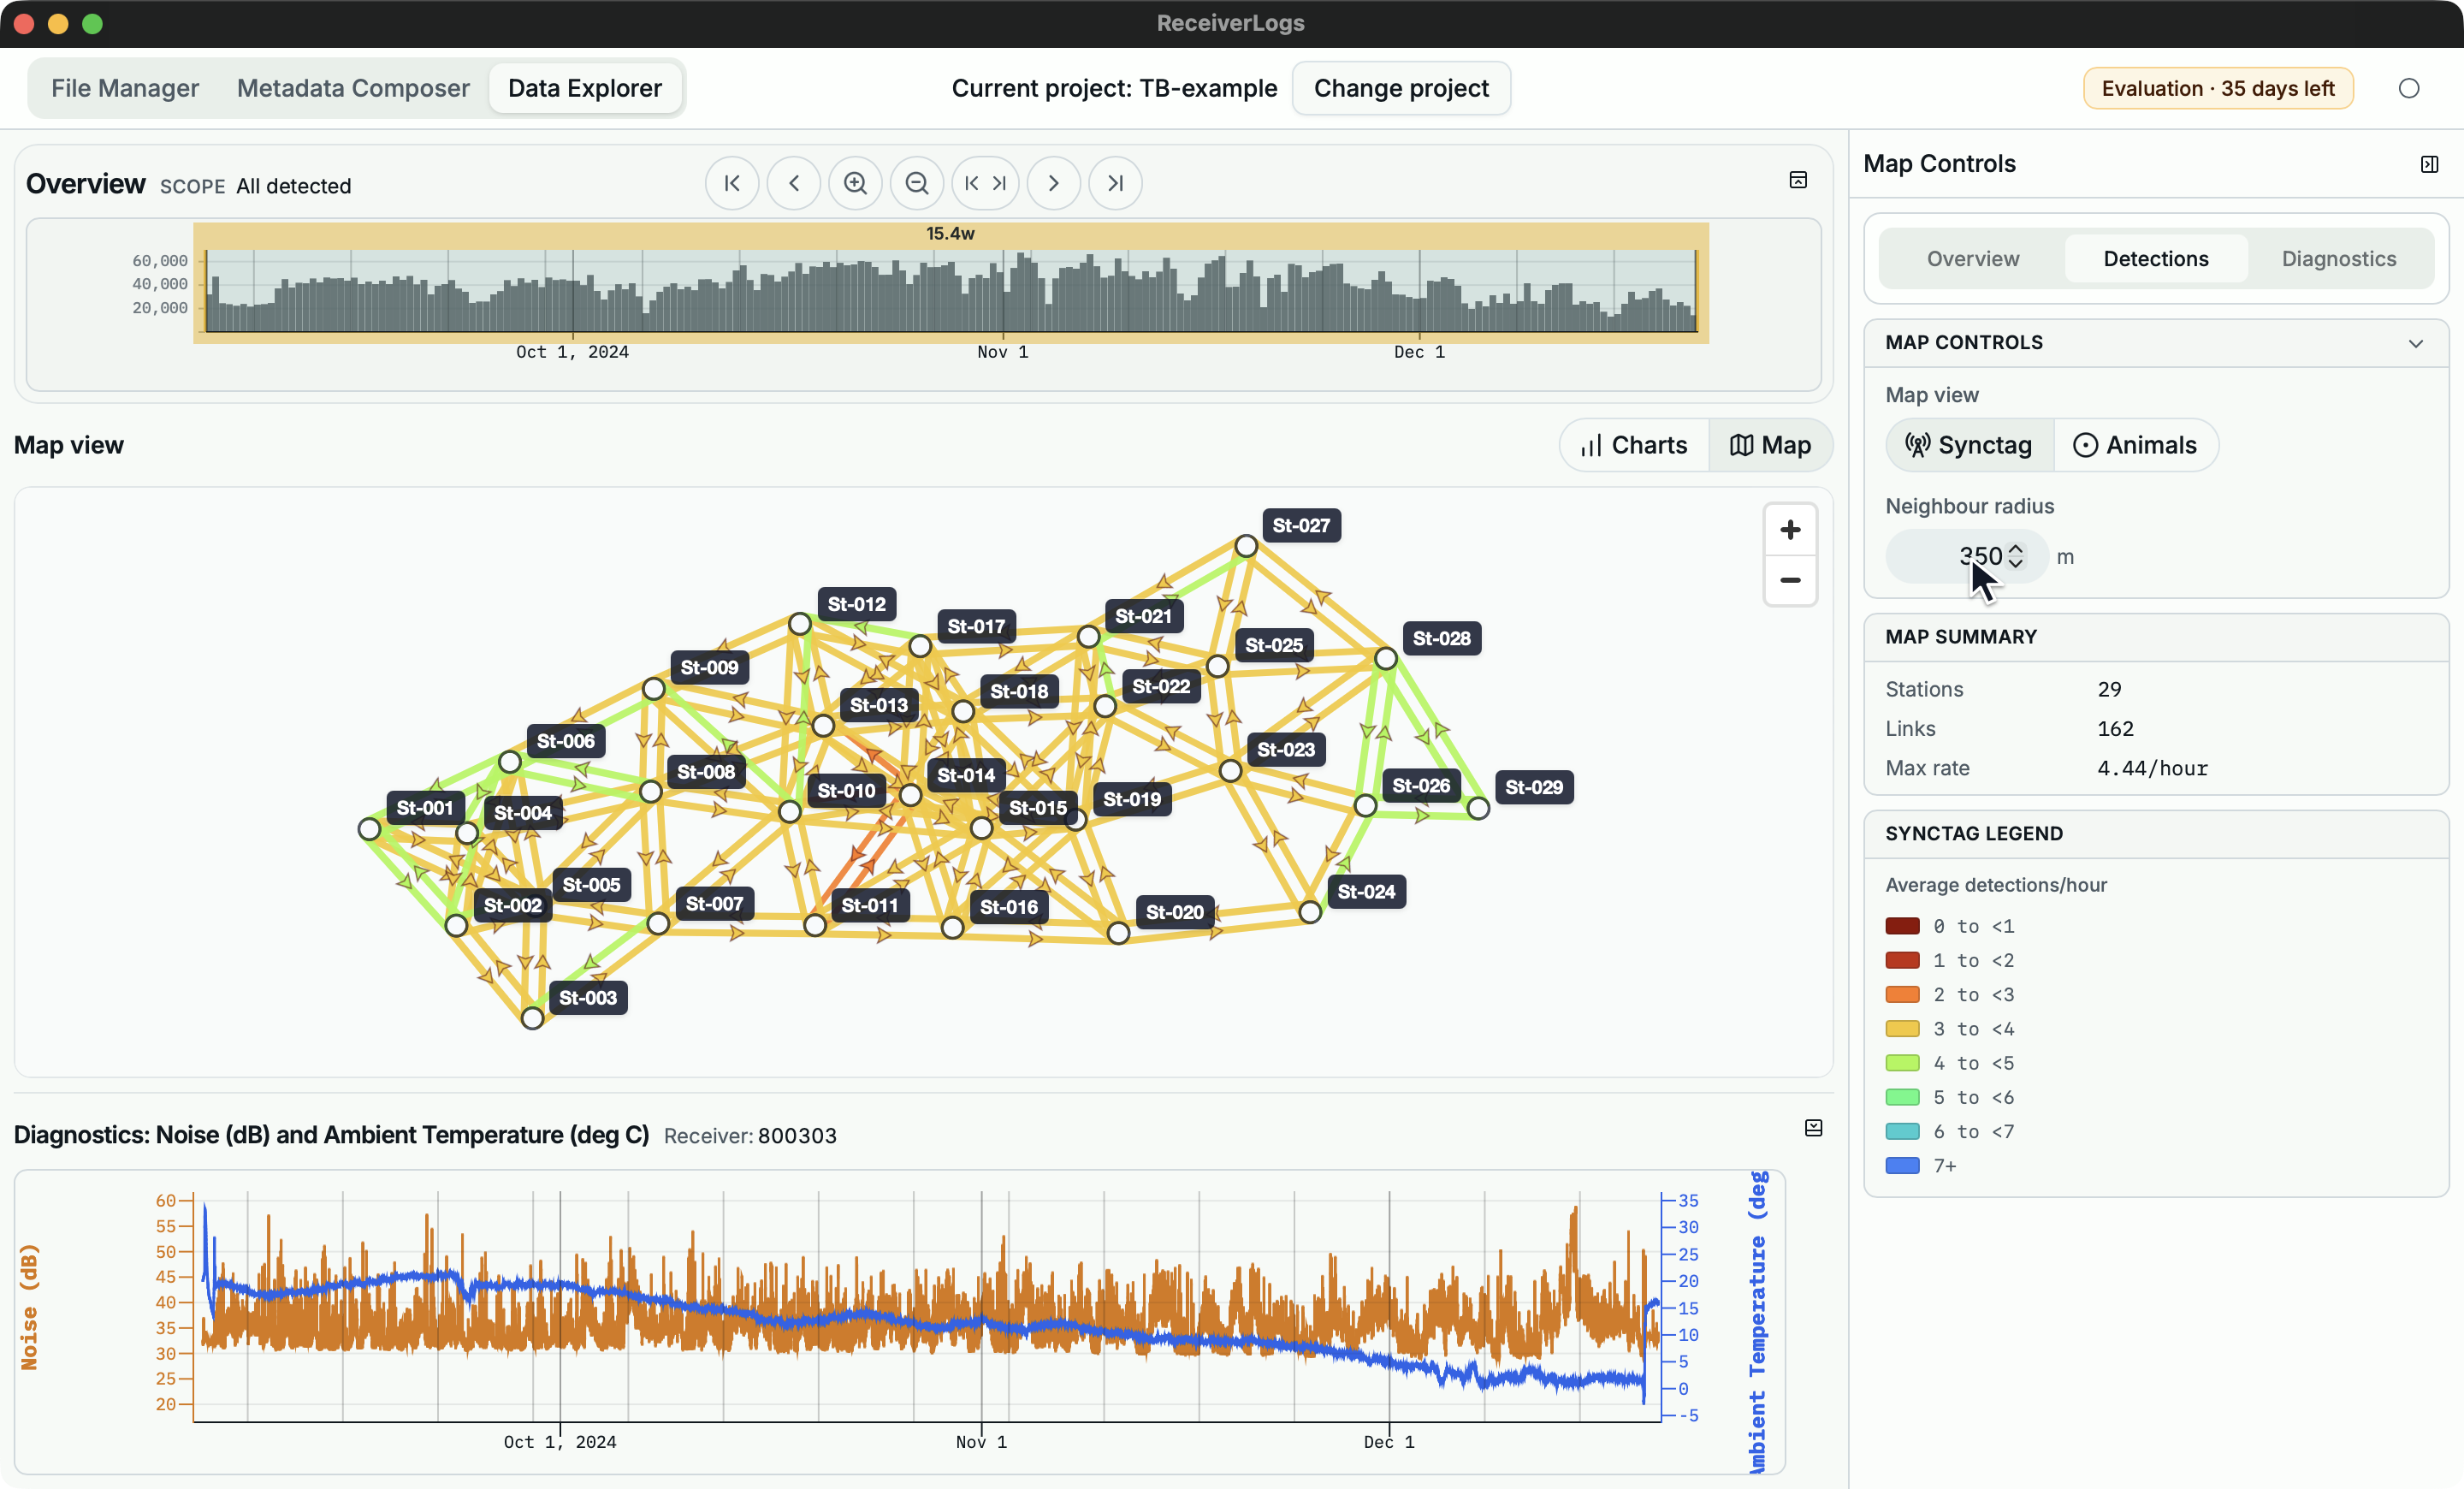
View station and detection context on the map
- Choose Map above the main detail area.
- Choose Synctag to compare receiver built-in transmissions between nearby stations, or Animals to show external detections by receiving station.
- In Synctag mode, adjust Neighbour radius and press
Enteror leave the field. - Hold
Alt/Optionwhile hovering for station, link, distance, detection, and rate details.
Inspect receiver diagnostics
- Expand the diagnostics section if it is collapsed.
- Choose a receiver from the Diagnostics controls or select a receiver row in a receiver-oriented chart.
- Choose the left and optional right diagnostic quantities.
- Drag across the diagnostics plot to zoom, or hold
Shiftwhile dragging to pan.
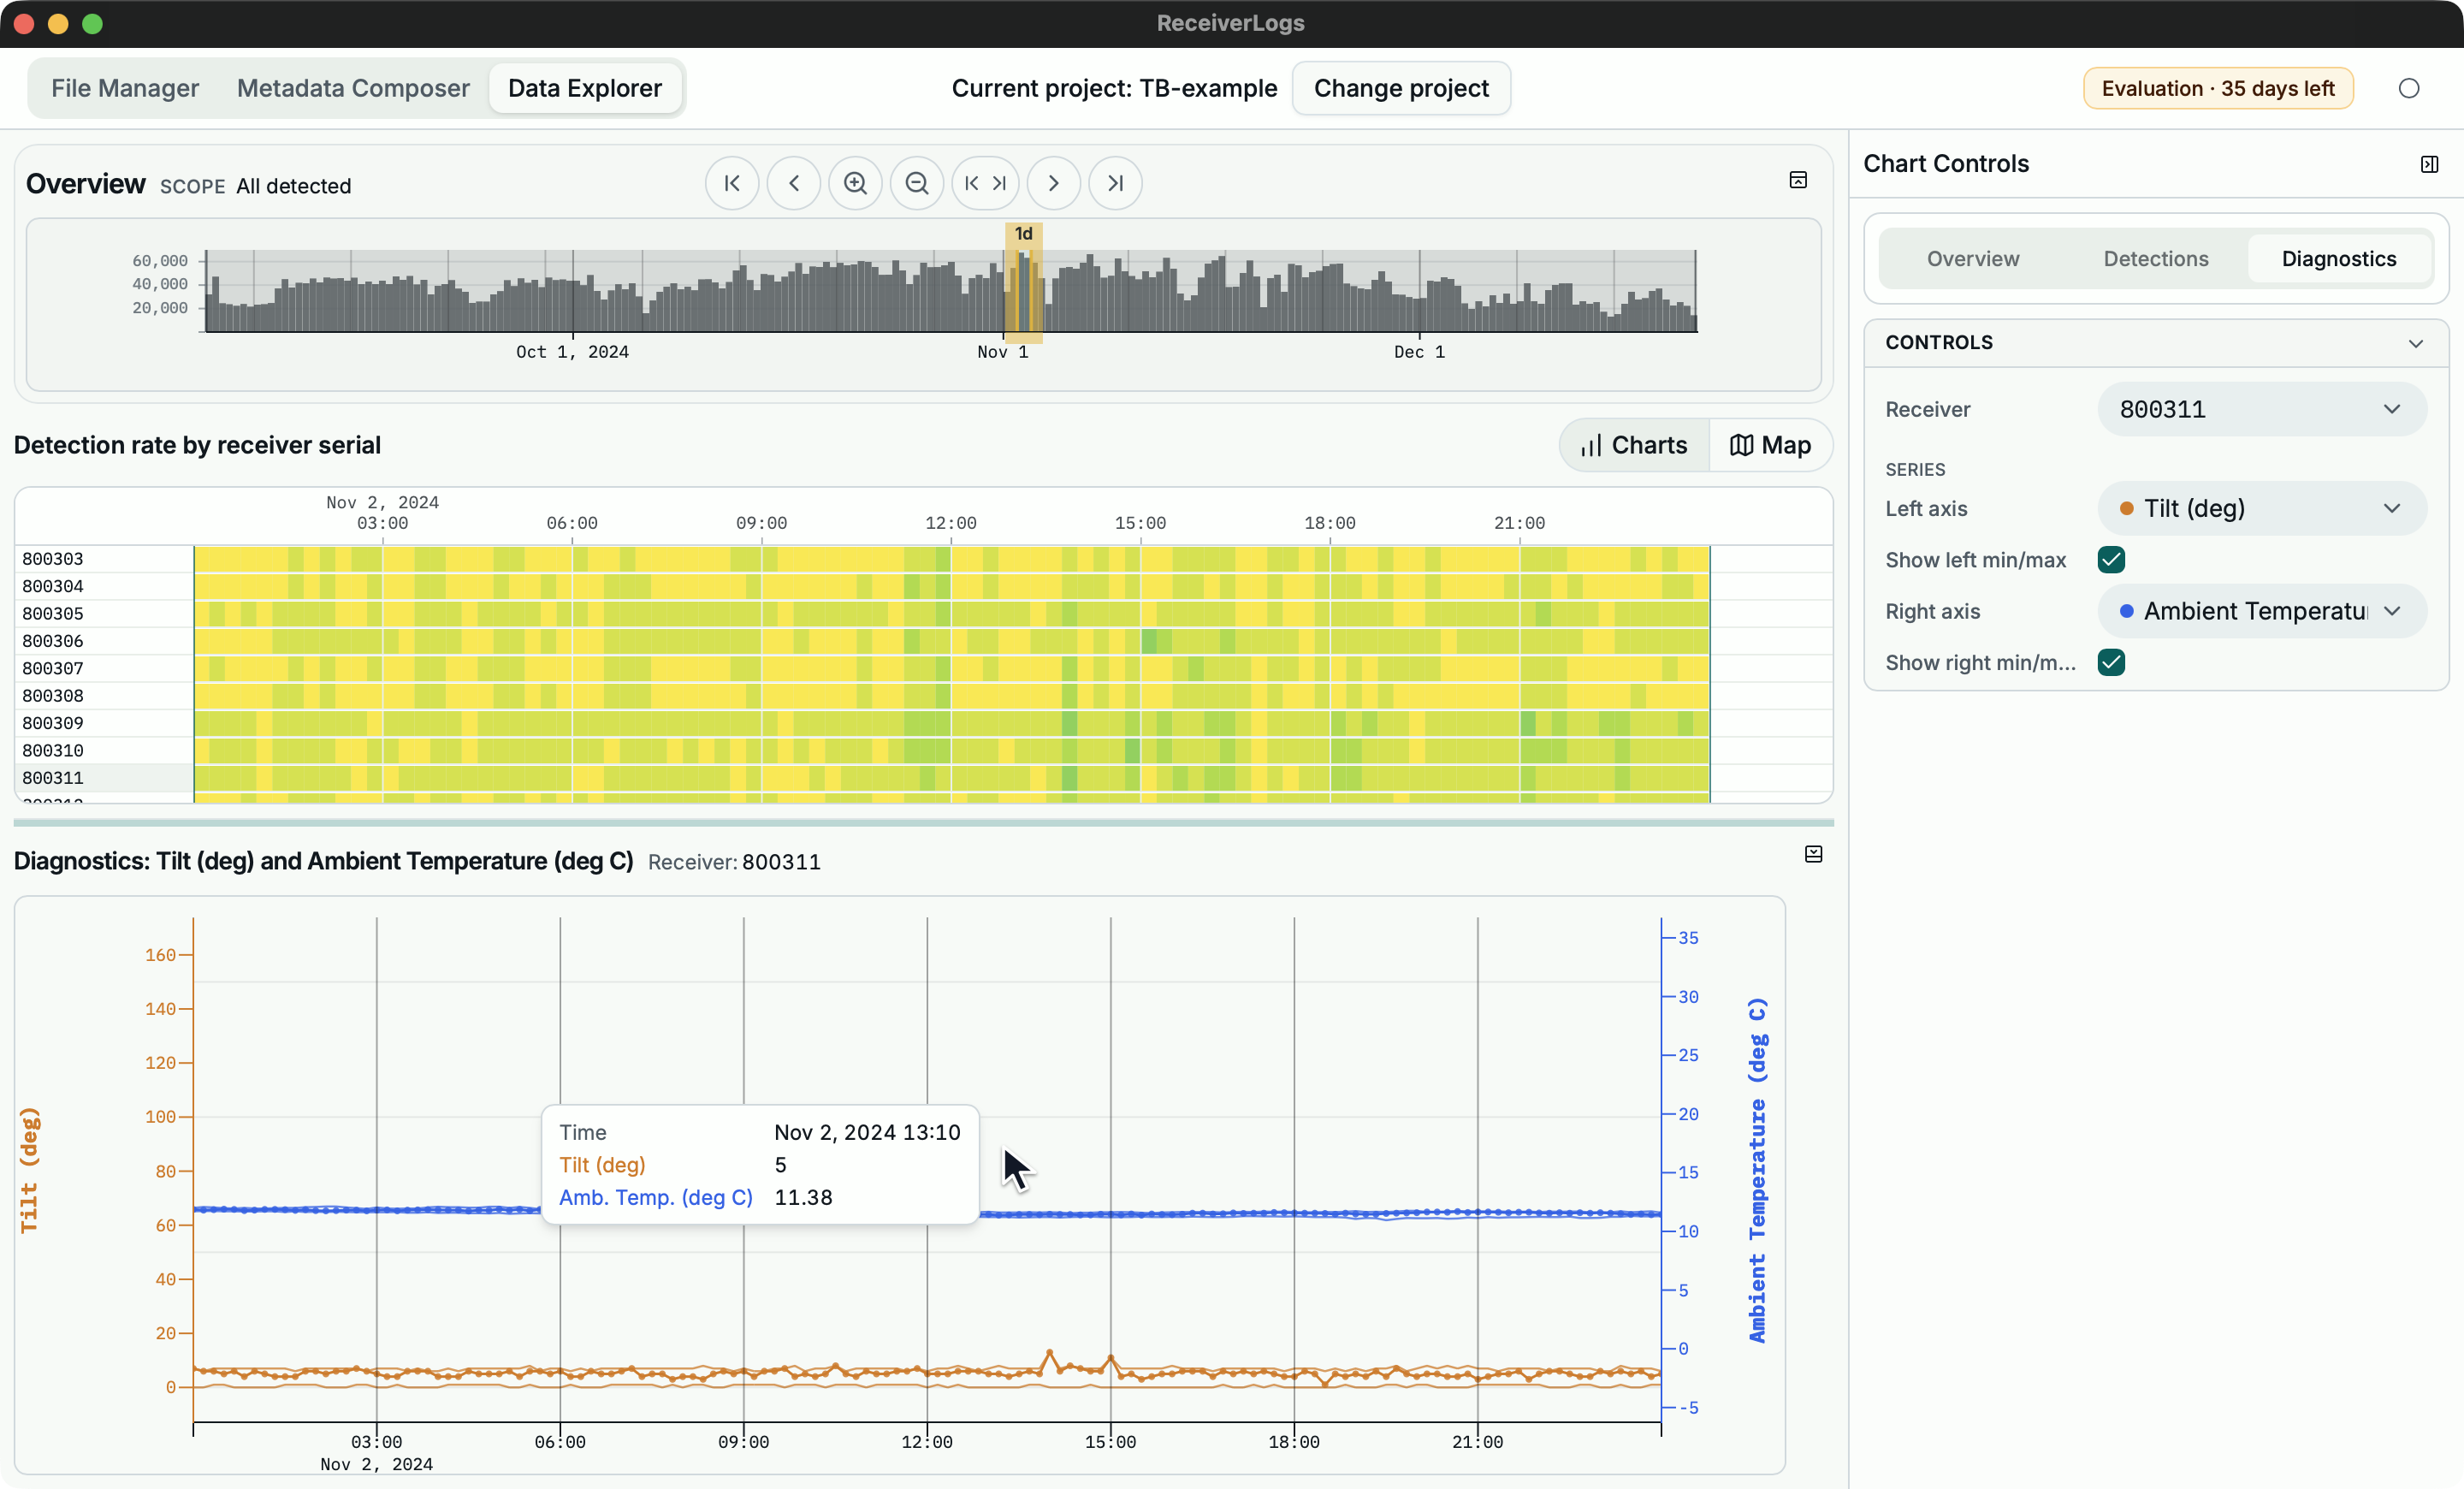
Data Explorer mental model
Data Explorer coordinates several views of one selected period:
- Overview shows activity across the full Dataset and contains the selected range.
- The detail chart shows detections within that range, grouped into rows and time bins.
- Map shows positioned stations and the selected overlay for the same range.
- Diagnostics shows supported receiver measurements for that range.
- The right-hand controls change grouping, display, map, and diagnostic options.
ReceiverLogs may align chart edges outward to complete display bins. The selection remains the period you chose; the slightly wider chart boundary prevents partial bins from being presented as complete ones.
When Data Explorer can open
| What you see | Meaning |
|---|---|
| No project open | Open a project in File Manager. |
| Updating Dataset | Wait for the active Dataset update to finish. |
| Dataset database needs repair | Return to File Manager and open the project for repair. |
| Reading dataset… | ReceiverLogs is opening the Dataset and determining its time range. |
| No detection records | The Dataset is healthy but contains no usable detection records. |
| Dataset query failed | ReceiverLogs could not load data for the current view; use the reported message and retry after resolving the cause. |
Time controls
The range toolbar and Overview modify the same selection. The controls let you:
- fit the full Dataset
- pan backward or forward
- zoom in or out
- enter or adjust the start and end of the selected period
Drag the Overview selection to move it without changing its duration. Drag an edge to change the duration. Drag elsewhere in the Overview to draw a new range.
The selected range is saved for the project. If the Dataset later becomes shorter or longer, ReceiverLogs adjusts an out-of-bounds saved range to a usable period.
Chart controls and interaction
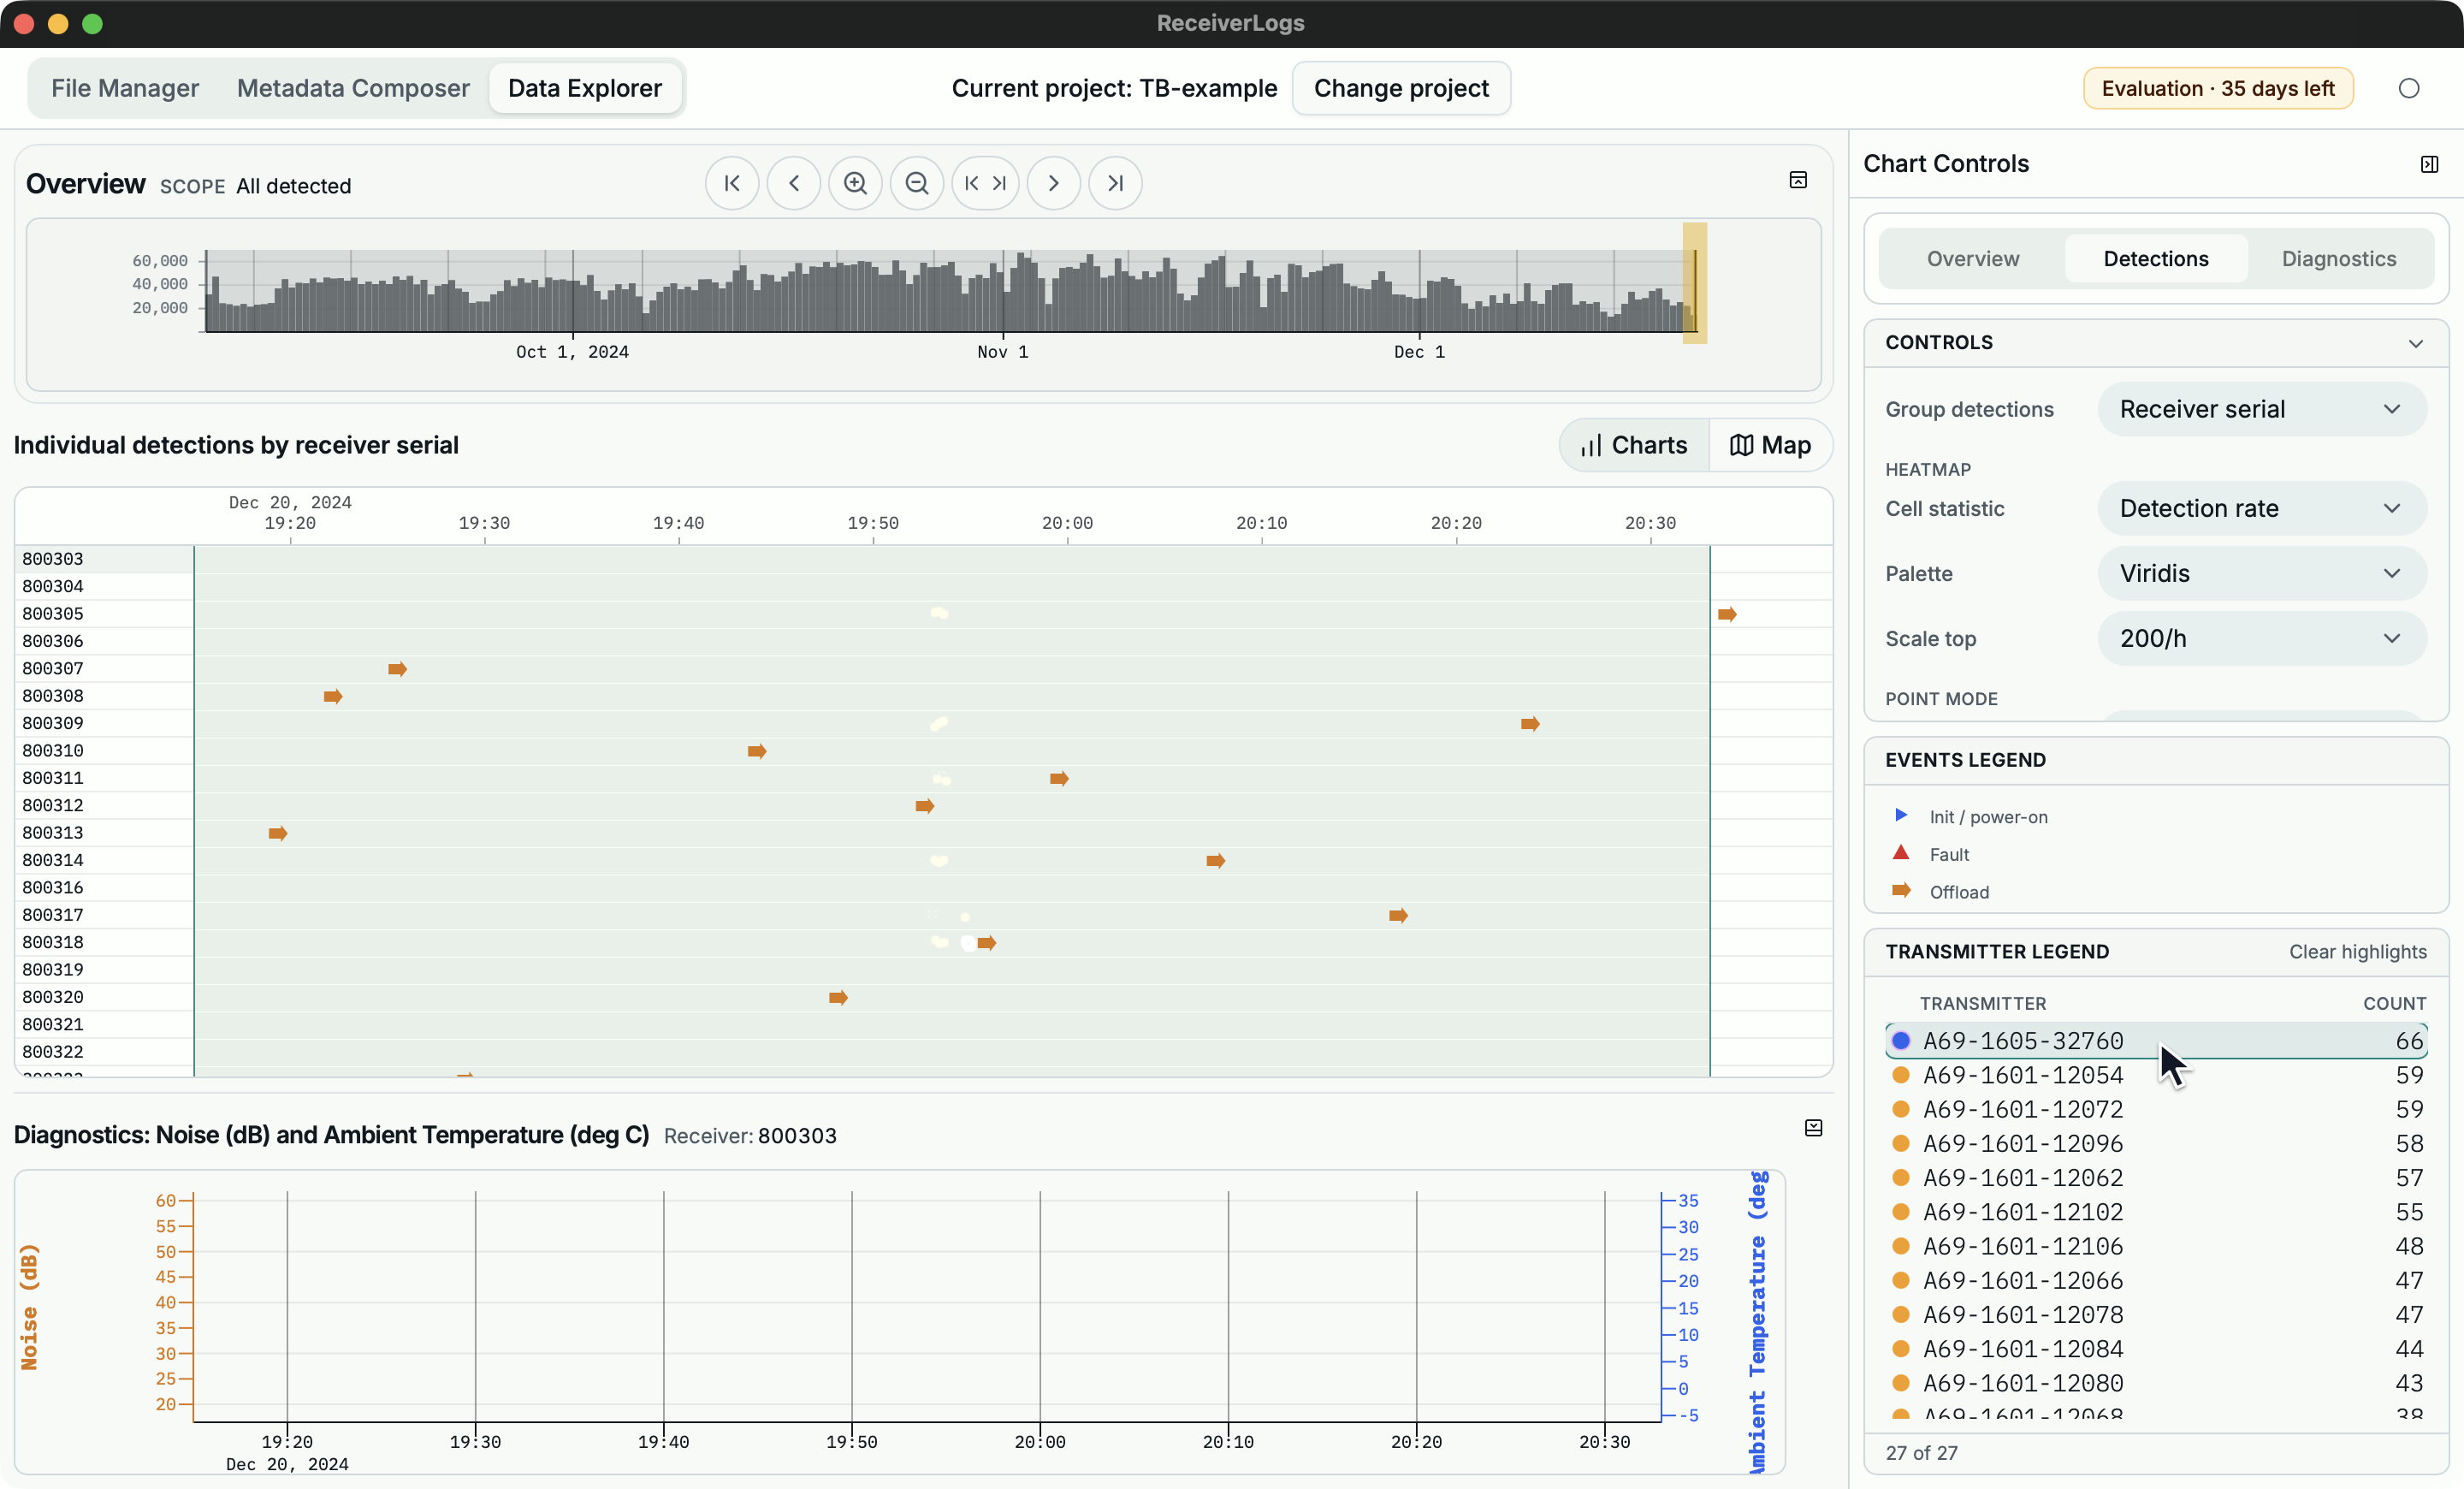
The detail chart switches between heatmap cells and individual detection points according to the Point Mode threshold. The Palette and Scale top options change visual encoding only; they do not change the underlying detections.
Supported pointer and keyboard interactions include:
- drag horizontally to zoom to a period
- hold
Shiftand drag, or use horizontal wheel/trackpad motion, to pan - pinch on a precision trackpad to zoom around the gesture position
- use
Alt/Optionhover to inspect exact values - use a mouse or keyboard on legend rows to emphasise or pin matching marks
- use Clear highlights or
Escapeto clear pinned emphasis
Touchscreen two-finger pinch is not currently available on the detail or diagnostics charts.
Cells or event layers may report that results are capped. Narrow the period or choose a more specific grouping when you need a complete uncapped view.
When the selected period is short enough for individual points, the event layer can show detections directly. Pin a ranked transmitter or receiver when you need its marks to remain emphasised while you compare the surrounding events.
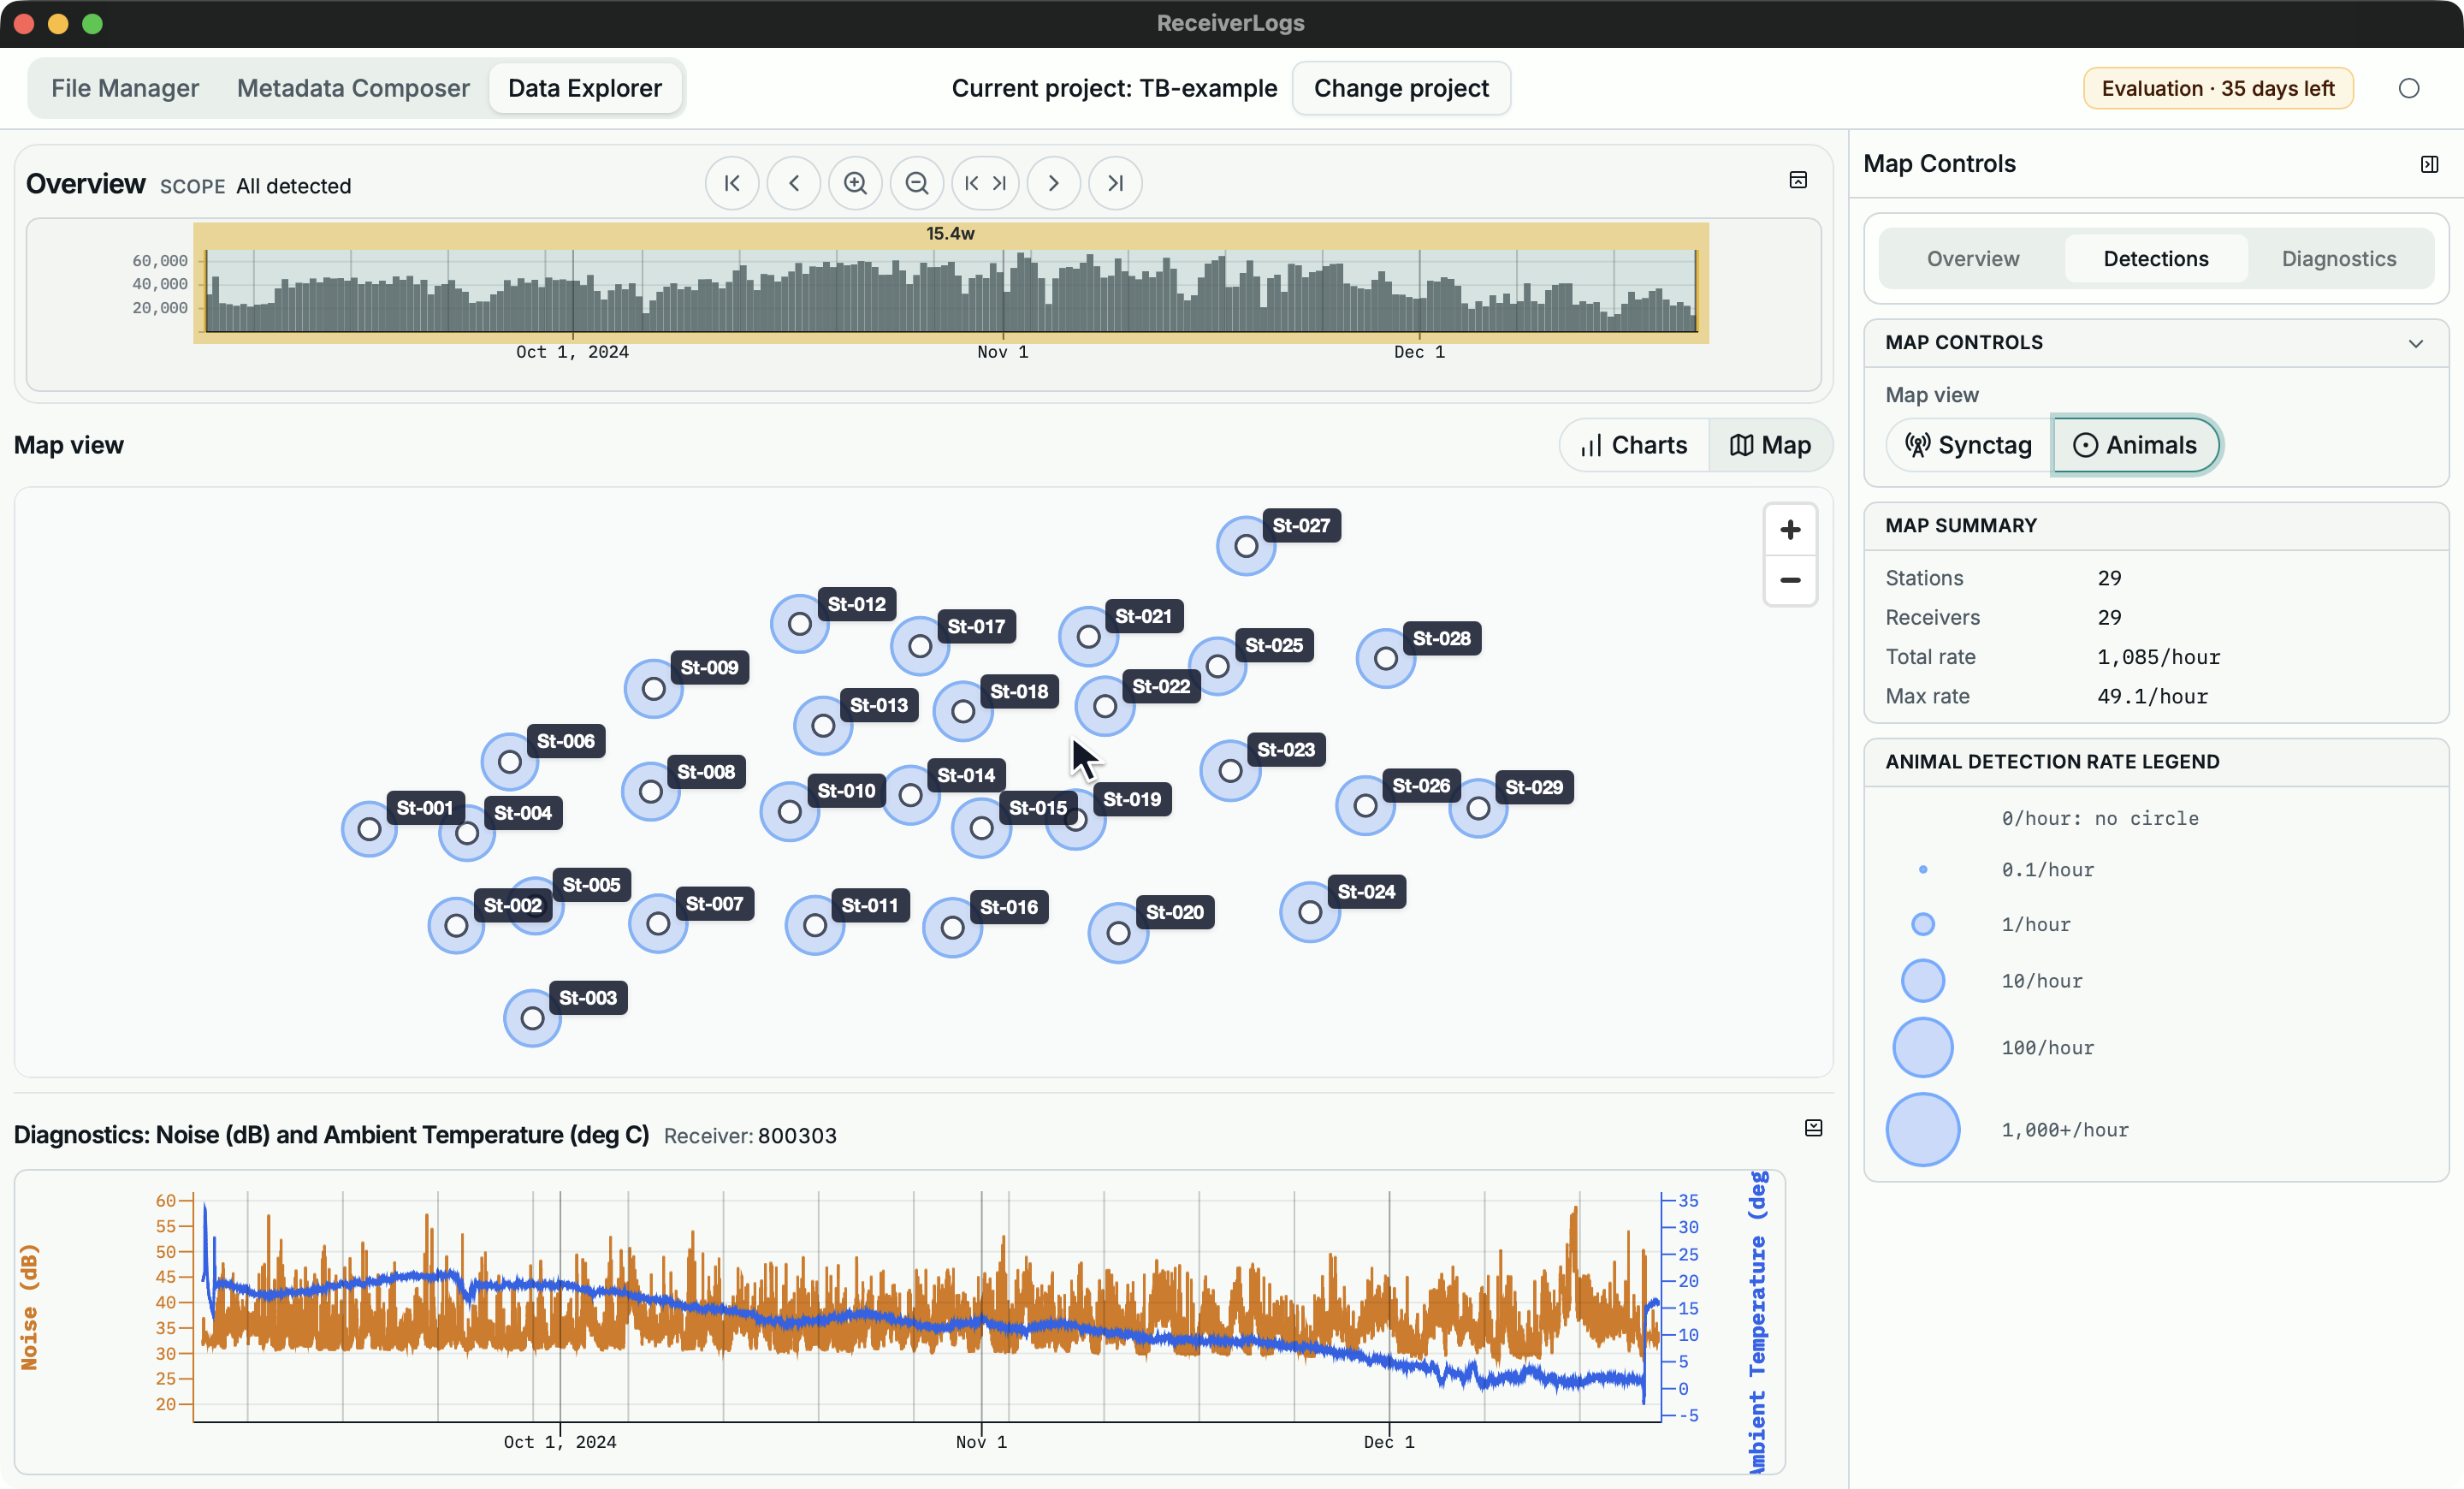
Map interpretation
Synctag draws directional links for receiver built-in transmitter detections between stations within the chosen neighbour radius. Redder link colours represent lower average detection rates; the fixed legend makes different periods comparable.
Animals draws circles for external detections grouped by receiving station. Circle area increases with average detections per hour. These detections do not need to be resolved to authored Animal metadata to appear on this overlay.
Station dots remain visible when the map suppresses text labels for a large station set. A + after a Map Summary count means the canvas does not show every qualifying link or receiver circle. Treat a Synctag count with + as a lower bound; narrow the period or neighbour radius for a complete view.
Map messages distinguish missing positions, no qualifying Synctag links, no qualifying animal detections, Dataset query failure, and map-rendering failure. After a failure, ReceiverLogs removes the earlier overlay rather than presenting it as current.
Diagnostics interpretation
The diagnostics plot shares the selected period. Its scale for each quantity is stable across supported receivers in the current Dataset, which makes receiver-to-receiver comparison easier.
The plot distinguishes No diagnostic records from No diagnostics in range. If the selected receiver has no supported diagnostic records, ReceiverLogs chooses the first available receiver. Collapsing diagnostics does not change the selected period; reopen it to continue reviewing diagnostics.
Layout and saved choices
The Overview, diagnostics section, and right-hand panel can be resized or collapsed. These changes affect layout only.
ReceiverLogs saves common project-specific choices such as grouping, chart statistic, event-layer mode, Overview count scale, palette, scale tops, Point Mode threshold, selected range, diagnostics receiver, and right-panel layout. Temporary hover and legend emphasis clears when the interaction or application session ends.
Continue with metadata
Raw receiver and transmitter-ID views work without metadata. To add station, animal, or device context, choose a Metadata Composer task. If a metadata-backed grouping is unexpectedly empty, repair the relationship.
Troubleshooting
| What you see | What to do |
|---|---|
| No project open | Open a project in File Manager. |
| Dataset database needs repair | Return to File Manager and repair the Dataset. |
| Updating Dataset | Wait for the update to finish. |
| No detection records | Include receiver logs that contain detections and choose Update Dataset, or confirm that the source logs contain none. |
| No detections in this scope | The saved transmitter-ID scope excludes all detections. This version does not provide a scope editor; preserve the project and contact ReceiverLogs support at support@franksmithxyz.com for recovery help. Initially send only the ReceiverLogs version and a description; do not attach a project, receiver logs, personal information, or confidential material unless support asks you to and provides a secure way to send them. |
| No detections in this range | Fit the full Dataset, choose another period, or use a raw grouping to check whether metadata relationships are responsible. |
| No station positions in this range | Repair station periods, positions, dates, or coordinates in Metadata Composer. |
| No neighbouring synctag detections in this range | Widen the period or review Neighbour radius and receiver metadata. |
| No animal detections in this range | Widen the period or confirm that the Dataset contains external detections. |
| No diagnostic records or No diagnostics in range | Choose another receiver or widen the period. |
cells capped, events capped, or + after a count | Narrow the period or grouping when you need a complete view. |
| Dataset query failed | Read the reported message, confirm that no update or repair is active, and retry after resolving the cause. |
Limitations
- Data Explorer currently focuses on detection records and supported receiver diagnostics.
- The current map provides station, Synctag, and external-detection overlays.
- Touchscreen pinch is not implemented.
- A restored transmitter-ID scope is visible but cannot currently be changed or cleared in Data Explorer.